


Product Categories
GINA products are available to the public via web portals and public-facing servers. Contact us for additional information.
This guide will direct you to a number of GINA’s product portals.
Single Band Products

VIIRS i04 Band - 3.74 μm (colorized)
The VIIRS 3.74 μm “Shortwave IR” channel is highly sensitive to the short wavelength energy emissions of fires; these emissions can be detected day and night, making this channel ideal for monitoring wildland fires. It is the basis for most fire-related products. While solar radiation reflected by clouds or the Earth’s surface does contribute to the total daytime energy measured in the channel, the signal from fires is usually much stronger. A special colormap is used to accentuate higher temperatures from potential fires.

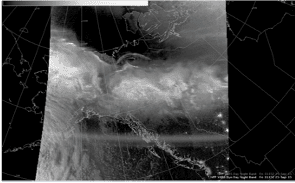
VIIRS i05 Band - 11.5 μm
The VIIRS 11.5 μm “Longwave IR” channel is used for continuous day/night cloud feature identification and classification, convective severe weather signatures, and hurricane intensity. It is less sensitive than other infrared window bands to water vapor absorption, and therefore improves atmospheric moisture corrections, aids in cloud and other atmospheric feature identification/classification, estimation of cloud-top brightness temperature and cloud particle size, and surface property characterization in derived products.
VIIRS DayNight Band

VIIRS Visible channels

VIIRS Infrared channels
MODIS Visible channels
 (3)")
MODIS AQUA and TERRA Infrared 11um (band 21)
MODIS band 31 is a longwave infrared channel with a wavelength of 11.0 μm. Similar to the VIIRS 11.5 μm this channel is used for continuous day/night cloud feature identification and classification, convective severe weather signatures, and hurricane intensity. It is less sensitive than other infrared window bands to water vapor absorption, and therefore improves atmospheric moisture corrections, aids in cloud and other atmospheric feature identification/classification, estimation of cloud-top brightness temperature and cloud particle size, and surface property characterization in derived productsScreen reader support enabled. The MODIS sensor in installed on Aqua and Terra satellites.

MODIS Infrared channels

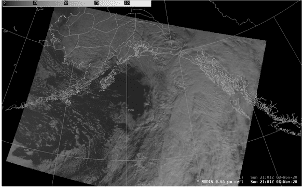
AVHRR Visible channels
")
AVHRR Band 5, 12.0 um
The 12um IR measures emitted energy from the surface or clouds, but it is often called the “Dirty Window” band because it is sensitive to moisture and particles aloft. When subtracted from the 11 um IR “clean window” it can identify areas of dust and volcanic ash.
")
AVHRR Band 4, 10.8 um
The 11um longwave IR band is a window channel because it is less sensitive to water vapor. This bands is used for cloud and other atmospheric feature identification/classification as well as estimation of cloud-top brightness temperatures.

AVHRR Infrared channels
RGB and Multispectral Products
RGBs and other multispectral products can be found on GINA’s 24-hour gallery and the feeder website.

TrueColor RGB

Snow/Cloud Discriminator
The Snow/Cloud Discriminator combines information from 10 different bands on VIIRS (6 during the day and 4 at night) to help distinguish clouds from snow and ice. Unlike other RGBs for snow and cloud discrimination, which only work during the day, the Snow/ Cloud Discriminator utilizes the Day/Night Band (DNB) so it works around the clock. This is particularly useful during those long winter nights. These products were developed by Steve Miller and Curtis Seaman at CIRA.

Snowmelt RGB
The 750-m SNPP and NOAA-20 VIIRS Snowmelt RGB is used to monitor snow on the ground and differentiate the microphysical characteristics of clouds (liquid versus ice). Specifically, this RGB utilizes the VIIRS 1.24-μm band that is highly sensitive to snow properties, including grain size and relative wetness. This RGB is useful for identifying areas of freezing rain and sleet accumulation, as well as for hydrological applications, such as snowmelt-enhanced flood events.

Night Time Microphysics
This RGB is designed to improve the distinction between clouds and fog or low stratus. The different between 10.8um and 3.7um is often used for a quick analysis of fog/stratus but this RGB adds another channel difference (10.8um -12um) as a proxy to cloud thickness and a repeat of the 10.8um to enhance areas of warm (low) clouds where fog is more likely.r green, and 0.64um for blue. It is used for discriminating ice/snow from clouds and for identifying burn scars from wildland fires.
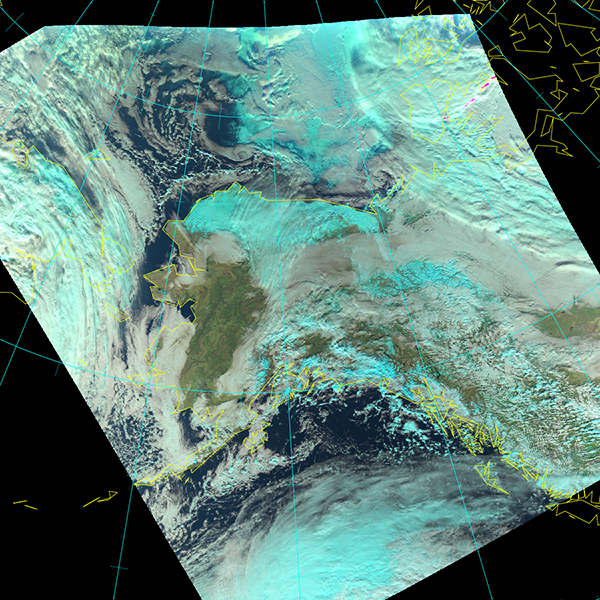
DayLandCloud RGB
This RGB has had many names in the past, but the most recent and recommended name is DayLandCloud RGB. It is used for discriminating ice/snow which from clouds. In this RGB ice and snow on the ground and ice crystals aloft in cirrus clouds appear cyan-blue while water clouds appear white. This RGB can also be used to identify burn scars from wildland fires which appear brown from whereas vegetation is green.
The VIIRS instrument on both NOAA-20 and SNPP use the same band combination: 1.6um for red, 0.87um for green, and 0.64um for blue. The MODIS instrument on TERRA-1 use same band combination of 1.6um for red, 0.87um for green, and 0.64um for blue. AVHRR from NOAA-19 has the correct bands for this RGB combination, 1.6um for red, 0.87um for green, and 0.64um for blue.

7_2_1
This RGB is similar to the DayLandCloud RGB but is uses MODIS band 7 at 2.1 um instead of band 6 at 1.6 um. It is used for discriminating ice/snow which from clouds but with the 2.1 um band is is a little more sensitive to fires and a little less sensitive to snow and ice. In this RGB ice and snow on the ground and ice crystals aloft in cirrus clouds appear cyan-blue while water clouds appear white. This RGB can also be used to identify burn scars from wildland fires which appear brown whereas vegetation is green.

DayLandCloudFire RGB
This RGB is created by assigning the 3.74um channel to red, 0.87um channel to green, and the 0.64um channel to blue. It is used to assess fire parameters and burn scars. These products were developed by Steve Miller and Curtis Seaman at CIRA.

Fire Temperature RGB
This RGB is created by assigning the 3.74um channel to red, 2.25um channel to green, and the 1.61um channel to blue. It is used to assess fire intensity and size, with fires ranging from red (lowest) to yellow to white (hottest or biggest). These products were developed by Steve Miller and Curtis Seaman at CIRA.

MIRS TPW

MIRS Rain Rate
MIRS Rain Rates are valid day or night, in all weather conditions and over non-frozen surface types. MIRS rain rates are from derived microwave sensors on multiple polar satellites. They provide a more complete picture of precipitation patterns, especially where radar coverage is unavailable, and they can locate areas of heavy rain that might otherwise be obscured by high clouds.

AMSR2 Rain Rate

MIRS CLW

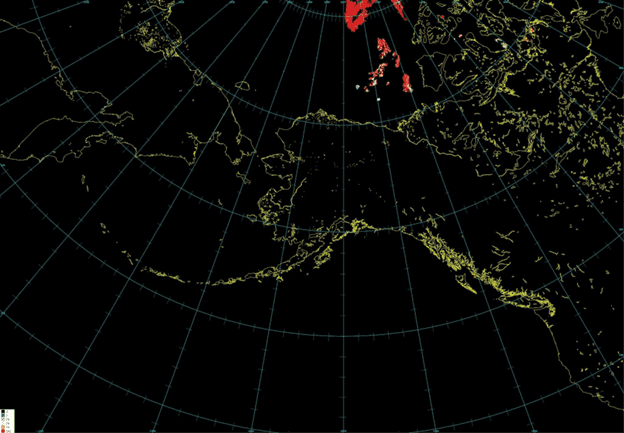
MIRS Sea Ice Concentration

AMSR2 Sea Ice Concentration

AMSR2 Multi-Year Sea Ice Concentration
Multi Year Sea Ice Concentration estimates the percentage of Multi Year Sea Ice Concentration within each pixel. The AMSR2 sensor is much higher resolution than the sensors used for MiRS, so ice concentration variations can be more detailed. It is especially effective to monitor sea ice changes in areas obscured by clouds in the infrared or visible wavelengths.

MIRS Snowfall Rate (SFR)

MIRS SWE
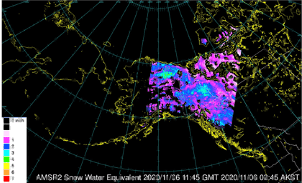
AMSR2 SWE

AMSR2 Snow Depth

AMSR2 Ocean Wind Speed

AMSR2 SST

Mosaics overlay common products from several polar satellites into a regional view with the latest image on top of older images. This provides a regional perspective of synoptic conditions.

Single Band IR Imagery Composites

MIRS Microwave Composites

ACSPO SST Composites

CSPP NUCAP Soundings

Gridded data (SPoRT & GINA)

Cloud Cover at Flight Levels
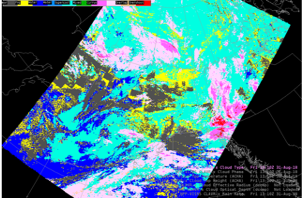
This product classifies cloud layers with colors that represent general height terms: low, mid, high, or some combination of the those levels.

Cloud Top Temperature

Cloud Top Heights

Cloud Phase
Cloud Type

Rain Rate
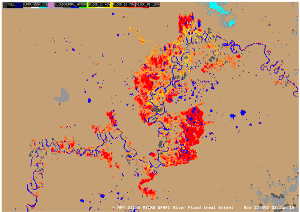
River Flood Areal Extent

River Ice Areal Extent

River Ice Concentration

VIIRS Ice Thickness
This Sea Ice Thickness product is based on VIIRS imagery so estimates can only be done in cloud-free areas. Sea Ice Thickness for each pixel is expressed in meters.
VIIRS Sea Ice Concentration
This Sea Ice Concentration product is based on VIIRS imagery so estimates can only be done in cloud-free areas. Concentrations are expressed as estimates the percentage of sea ice within each pixel.

VIIRS Ice Surface Temperature
Displays the temperature of the ice surface in degrees Celsius but only where skies are clear since with VIIRS the surface is obscured by clouds.

Fire Heat Points (VIIRS Active Fires Detection Algorithm - VAF)
Software that identifies points that are likely active fires. Points area derived from an algorithm that uses the VIIRS I04 (3.75 um) to find high brightness temperatures, and then compares those locations wth the VIIRS I05 (11.5 um) and reflectance bands I01 (0.64 um), i02 (0.87 um) to isolate only on hot pixels that are caused by an active fire.

ACSPO SST
The Advanced Clear Sky Processor for Oceans (ACSPO) is an algorithm used to generate SST products under clear skies from VIIRS, MODIS, and AVHRR imagery data.
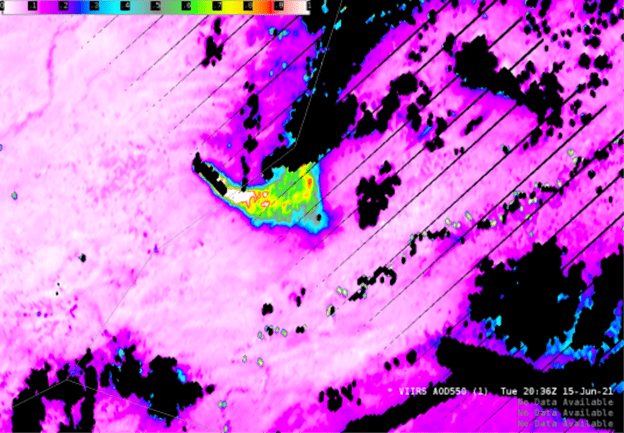
VIIRS Aerosol Optical Depth (AOD)
The 750-m SNPP and NOAA-20 VIIRS Snowmelt RGB is used to monitor snow on the ground and differentiate the microphysical characteristics of clouds (liquid versus ice). Specifically, this RGB utilizes the VIIRS 1.24-μm band that is highly sensitive to snow properties, including grain size and relative wetness. This RGB is useful for identifying areas of freezing rain and sleet accumulation, as well as for hydrological applications, such as snowmelt-enhanced flood events.